
Admin Only
How to Access Reports?
- From the system left navigation panel, click
 . The Reports page opens.
 - Click the Overall Report list arrow, then select the report you want to view as in the following figure.

Overall Report
Overall report is the landing page for mentioned personas. It gives them insights about their organization/segment performance and important metrics.
Filters available are:
- Filter by Date
- Last 7 days
- Last 30 days
- Last 12 months
- Custom
- Filter by Segment
- Organization hierarchy is available to select any segment level.
- In case “View segments report aggregated under the selected organization / segment” is selected, sub-segments will be considered.
Insights
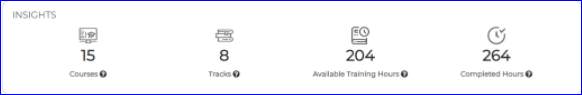
Courses Count
This count displays total number of courses published and available for trainees to enroll in. Only request to join courses are displayed as those are the courses available in Course Catalog for anyone to enroll in. Once clicked, user is redirected to courses report page.
Duration filter
Once a filter is selected courses that are available for enrollment in this duration will be counted. So below courses will be included:
- Courses that have rounds with no end date and start date is within or before selected duration.
- Courses that have rounds with end date within the selected duration
- Courses that have rounds with end date after the selected duration, but its start date is within or before selected duration.
Segment Filter
- In case organization is selected count will include all published courses created on organization level and any courses created on any segment.
- In case a segment is selected count will include all published courses created on organization and courses created on selected segment, and sub-segment in case aggregation is selected.
Tracks Count
This count displays number of tracks that were available for trainees to join. Once clicked, user is redirected to tracks report page.
Duration filter
- Once a date filter is selected, tracks that were created before filter’s end date will be included in count.
- Any track created after filter end date, will not be included.
Segment filter
- In case "All Levels" is selected total of tracks created on organization and segments are included.
- In case a specific segment selected Displays tracks that are created on organization level + tracks published on selected level (respecting segments aggregation).
Available Training Hours
This count displays total number of training hours added on courses’ rounds including only courses that are available in the selected duration and segment will be included. When a course has multiple rounds, average of all rounds’ training hours will be calculated. Request to join and invitation only courses are included.
Duration filter
- Only courses that were available for trainees during the selected duration will be included.
- Training hours of these courses will be included:
- Courses that have rounds with no end date and start date is within or before selected duration.
- Courses that have rounds with end date within the selected duration
- Courses that have rounds with end date after the selected duration but its start date is within or before selected duration.
Segments filter
- Training hours of these courses will be included:
- In case organization is selected count will include all published courses created on organization level and any courses created on any segment.
- In case a segment is selected count will include all published courses created on organization and courses created on selected segment, and sub-segment in case aggregation is selected.
Completed Training Hours
This count displays total number of training hours of completed courses of trainees in selected segment during the selected duration. In case trainee completed 2 rounds of the same course, average will be calculated for this trainee.
Duration filter
- Displays total number of training hours completed by trainees in the selected duration.
Segment’s filter
- Should display total hours completed by trainees in selected segment.
- "All Levels" is selected total hours of completed courses by trainees on organization and segments are included.
- Specific segment selected total hours of completed courses by trainees who are in selected level in selected duration.
If aggregated check is selected, it will contain data from sub-segments as well.
Top Trainees
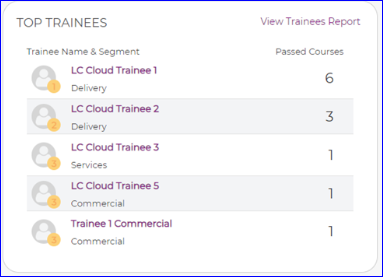
A leaderboard is available and displays top 5 trainees that completed and passed highest number of courses. A list that contains trainee name, segment name and number of completed courses and list is ordered by highest number of completed and passed courses. There’s a link to trainees’ report to drill down to more details about your trainees.
Duration filter
- List of trainees will be filtered by rounds’ completion date, only trainees who have completed rounds in the selected duration will be included in this list.
Segments filter
- Top 5 trainees in the selected segment will be displayed.
- If organization is selected, it will display data from the whole organization.
- If “aggregated segments” is checked, sub-segments’ data will be included.
Top Visited Courses
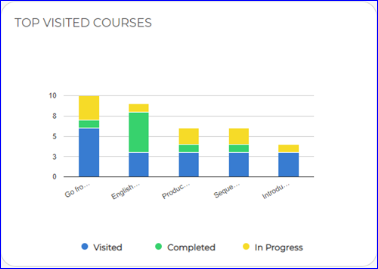
A stacked chart displays top 5 courses with highest number of visits. This chart helps concerned users with their courses’ engagement, if the course has high number of visits but low number of in progress, that means that course details might not be interesting, but trainees are interested in this topic. Only courses with number of visits calculated will be available in chart
It displays 3 types of info:
- Visited: This count includes number of un-enrolled trainees who opened the course page. Any enrolled trainee opens course page is not included in this count. If any trainee after opening course page enrolled in it, he will still be counted in visits count.
- In progress: This count includes number of enrolled trainees in any round of this course but didn’t complete it yet. Once trainee completes the course, he will be removed from in progress count and counted in completed count.
- Completed: This count includes number of trainees who completed any round of this course.
N.B.: This chart will display data and start counting them after the upgrade of client’s environment with release containing this feature as there’s a new database created that saves this data.
Once chart is clicked, user is redirected to courses report page.
Duration filter
- Includes top 5 courses that have visits during the selected duration and then gets count of completed and in progress during the selected duration too.
Segments filter
- If the organization is selected, chart data will be display top visits based on trainees from the whole organization.
- If a segment is selected, only trainees’ visits from this segment will be included.
- If segments are aggregated, sub-segments data will be displayed.
Employees Engagement
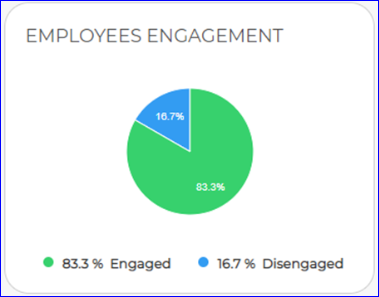
A pie chart displays trainees’ engagement in LearningCurve. It displayed data into 2 categories:
- Engaged trainees: Number of trainees that logged in the system respecting the selected filters.
- Disengaged trainees: Number of trainees who didn’t log in the system respecting the selected filters
Once chart is clicked, user is redirected to trainees’ report page.
Duration filter
- This filter allows the admin to know the engagement percentage of trainees during the selected time frame.
Segments filter
- This filter allows the admin to filter the engagement chart based on the selected segment.
Courses Progress
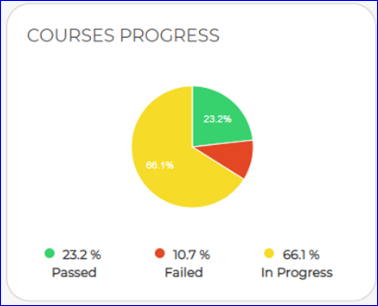
It’s a pie chart that displays trainees’ courses status (Pass, fail and in progress) in the organization in all courses available respecting the selected filters. Once chart is clicked, user is redirected to Courses’ report page.
Duration filter
- When a duration is selected, it displays trainees progress for courses available in the selected duration
Segment filter
- Progress for trainees in the selected segment will be calculated and displayed in the chart.
Overall Satisfaction

As we apply Kirkpatrick effectiveness measurement model, LearningCurve supports level 1 which is trainee’s reaction about their enrolled course. And as administration/management users are interested in this value, courses satisfaction percentage is added in the overall report.
A donut chart is displayed having the overall satisfaction percentage of all created courses that have course feedback enabled to trainees. Once chart is clicked, user will be redirected to courses feedback report page.
Calculation: Average of all courses feedback gathered respecting the selected duration and segment.
Duration filter
- When a duration is selected, it displays average of course feedback forms submitted in the selected duration.
Segment filter
- When a segment is selected, it displays satisfaction results submitted by trainees in this segment only.